Top 21 Promotional Products According to 2025 Industry Sales
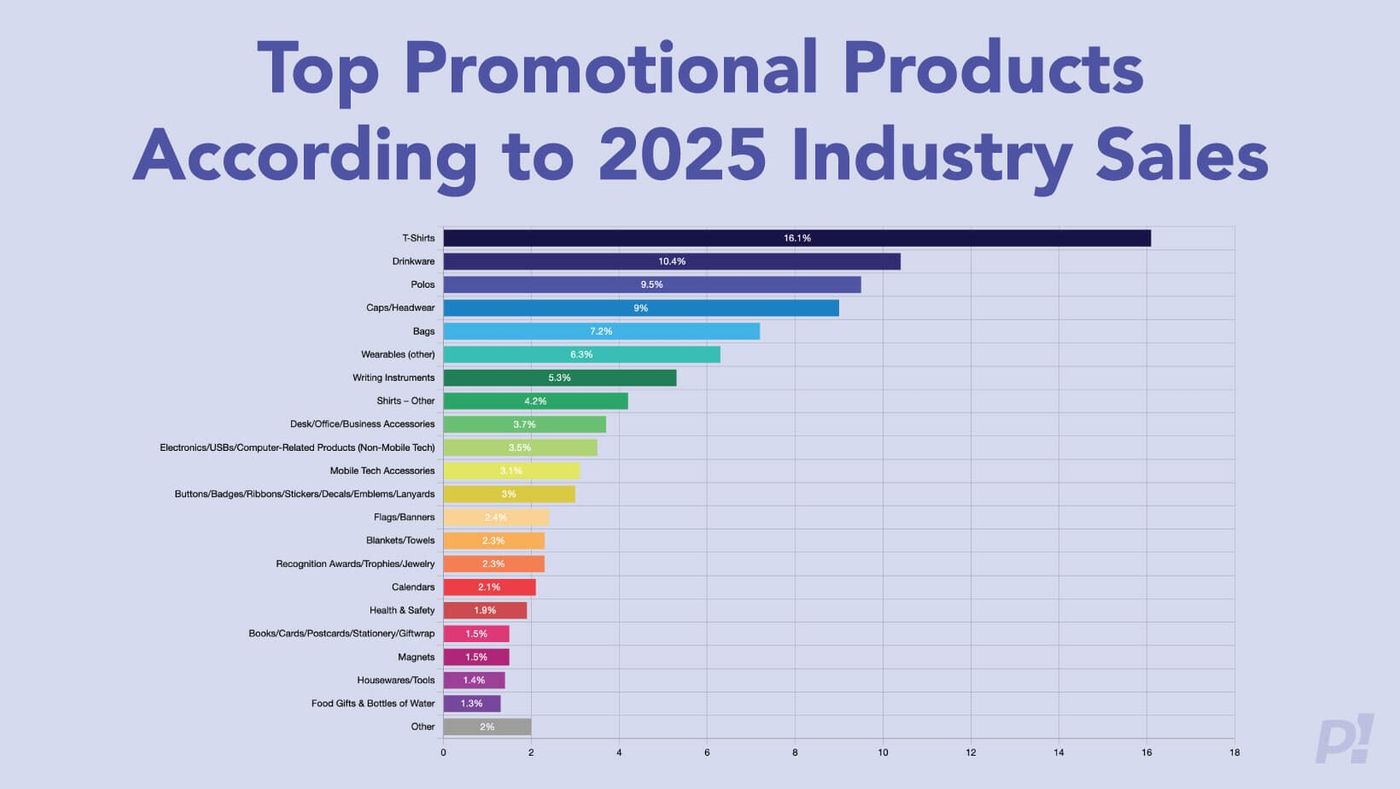
Want a quick reality check on what actually sells in promotional products? Follow the money. Industry sales data shows where brands are investing in the $27.7 billion industry, and it also hints at what recipients are most likely to keep, use, and show off.1 Below are the top 21 promotional product categories in 2025, listed in order, with sales amount and market share percentage, plus a quick note on why each category performs so well. This market research and charts were conducted and provided by the Advertising Specialty Institute.2 The top 7 promotional products categories below fit within the top 5 promotional products that people actually keep and use.3
What does this mean?
These categories are great investments for your marketing dollars because they get used over and over again, giving your marketing exposure every time they are used.
1. T-Shirts - $4,283 million (16.1%)
T-shirts lead the pack because they are wearable, visible, and easy to distribute at scale. With the right design, they become part of someone’s weekly rotation, which means ongoing impressions.
2. Drinkware - $2,766 million (10.4%)
Drinkware wins because it becomes a daily habit item. Tumblers, mugs, and water bottles get used at desks, gyms, and commutes, keeping logos in constant rotation.
3. Polos - $2,527 million (9.5%)
Polos are a go-to for a clean, professional look. They shine for uniforms, events, and team apparel where brands want to look polished and consistent.
4. Caps and Headwear - $2,394 million (9.0%)
Hats are high visibility and low effort. If a cap fits well and looks good, people wear it everywhere, which turns one item into a moving billboard.
5. Bags - $1,915 million (7.2%)
Bags are practical, reusable, and seen in public, which is the perfect combo. Tote bags, backpacks, and drawstrings work especially well for events, schools, and retail.
6. Wearable Accessories - $1,676 million (6.3%)
This category is where you find the fun extras beyond shirts and polos. Items such as scarves, gloves, and socks.
7. Writing Instruments - $1,410 million (5.3%)
Pens keep selling because they keep getting used, and they get borrowed, which multiplies reach. The secret is choosing pens that write smoothly and feel good in your hand.
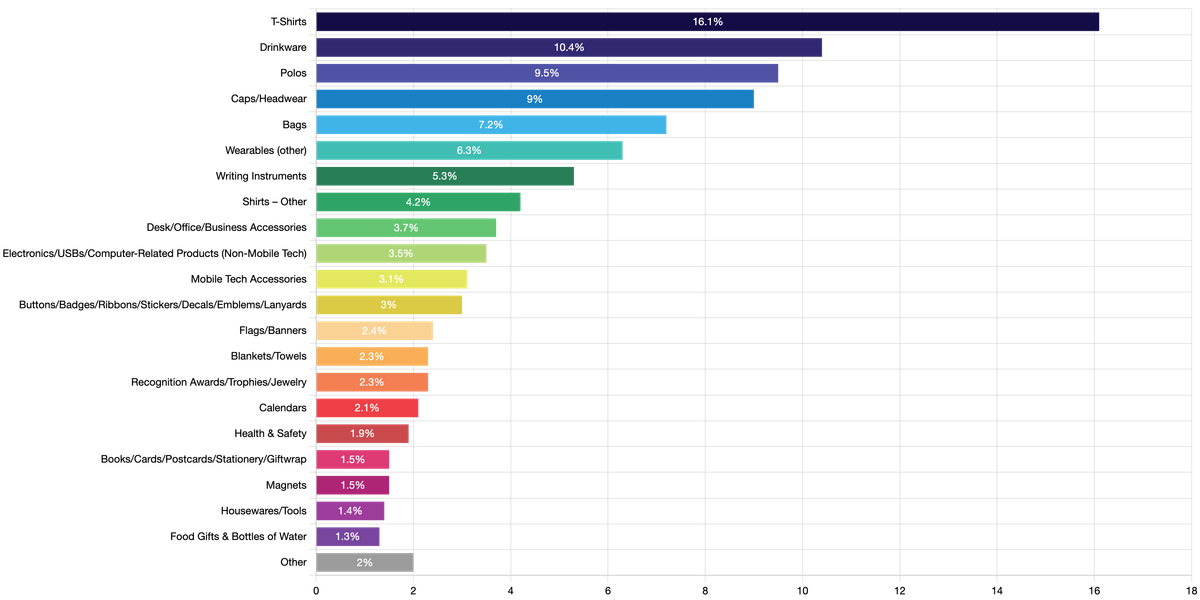
8. Shirts (Other) - $1,117 million (4.2%)
This includes shirt styles beyond classic tees, to include button-down shirts, often tied to uniforms, events, and layered looks. It performs well because it offers variety while still being wearable and visible.
9. Desk, Office, Business Accessories - $984 million (3.7%)
Office items stay put, which makes them great for consistent brand exposure. If it lives on a desk, your logo becomes part of the workday.
10. Electronics, USBs, Computer-Related Products, non-mobile tech - $931 million (3.5%)
Tech items tend to feel useful and a little premium. They also get kept longer because people hate throwing away something that could solve a future problem.
11. Mobile Tech Accessories - $825 million (3.1%)
Phone-related tech items are used constantly because phones are in constant use. This category is perfect for modern audiences because it fits everyday behavior.
12. Buttons, Badges, Ribbons, Stickers, Decals, Emblems, Lanyards - $798 million (3.0%)
These are low-cost, high-participation items. Lapel pins, for example, show pride of being part of something bigger than themselves. They work great for schools, awareness campaigns, events, and team pride because they are easy to wear or display.
13. Flags and Banners - $638 million (2.4%)
Large format visibility is the name of the game here. Banners and flags are ideal for events, stadiums, storefronts, and photo backdrops, which help brands show up in pictures.
14. Blankets and Towels - $612 million (2.3%)
Comfort items get kept, and they tend to stay in homes, cars, and travel bags for a long time. They also have great imprint visibility when used in public settings.
15. Recognition Awards, Trophies, Jewelry - $612 million (2.3%)
Recognition products are tied to emotion, achievement, and pride. That emotional attachment is why they stick around, often displayed for years.
16. Calendars - $559 million (2.1%)
Calendars are a classic because they deliver daily impressions for a full year. If it is on a wall or desk, you are getting repeated exposure without extra effort.
17. Health and Safety - $505 million (1.9%)
Health and safety items work because they communicate care and preparedness. They are especially strong for workplaces, schools, and organizations focused on wellbeing.
18. Books, Cards, Postcards, Stationery, Giftwrap - $399 million (1.5%)
Paper products still matter, especially for direct mail, events, and thoughtful touchpoints. They work best when the design feels intentional and brand-aligned.
19. Magnets - $399 million (1.5%)
Magnets are small but mighty because they live on fridges, filing cabinets, and office surfaces. They tend to stay up for a long time, especially when they are useful or well designed.
20. Housewares and Tools - $372 million (1.4%)
Tools and household items signal practicality and durability. They are great for brands that want to be associated with reliability, especially in home services and construction.
21. Food Gifts and Bottles of Water - $346 million (1.3%)
Food and beverage gifts create instant positive association. They are also easy to distribute at events, meetings, and community programs where convenience matters.
Other Promotional Products - $532 million (2.0%)
This “other” bucket includes everything outside the top categories. It is a reminder that niche products can still perform when they match the audience and the moment. Promotional items in this category are also more unique, often making them more memorable.
The big takeaway is simple. The categories that dominate sales are those that fit into real-life, daily routines, work environments, and public settings. If you want promotional products that work harder, start with what already wins, then tailor the category to your audience, your event, and your goal.
References:
- “North American Promotional Products Industry Hits Record $27.7 Billion in 2025, Outperforming U.S. Economic Growth.” Yahoo Finance.
- “State of the Industry 2025 - Top Product Categories.” Advertising Specialty Institute.
- “Top 5 Promotional Products People Actually Keep and Use.” Perfect Imprints.
Order Custom Top 21 Promotional Products According to 2025 Industry Sales Today
Our team can help you pick the right product, decoration, and quantity for your project. Reach out and we’ll send tailored ideas — usually within one business day.